
Phân tích & Hướng dẫn làm bài Pie Chart IELTS Writing Task 1
Writing task 1 Pie chart/graph – biểu đồ hình tròn hay biểu đồ dạng bánh là dạng biểu đồ chứa các thông tin của các danh mục dùng để phân tích hoặc so sánh thường được sử dụng trong đề thi IELTS Writing Task 1. Mỗi một danh mục được thể hiện bằng một phần trong hình tròn và được phân biệt bằng một màu riêng biệt. Thường sẽ có bảng chú thích tên các hạng mục và bảng tương ứng. Phần có màu càng lớn cho thấy số liệu của hạng mục đó càng lớn và ngược lại. Trong bài viết này, chúng ta sẽ tìm hiểu về Pie Chart và cách viết Pie Chart trong IELTS Writing Task 1 nhé!

DOL IELTS Đình Lực
Mar 27, 2023
2 mins read
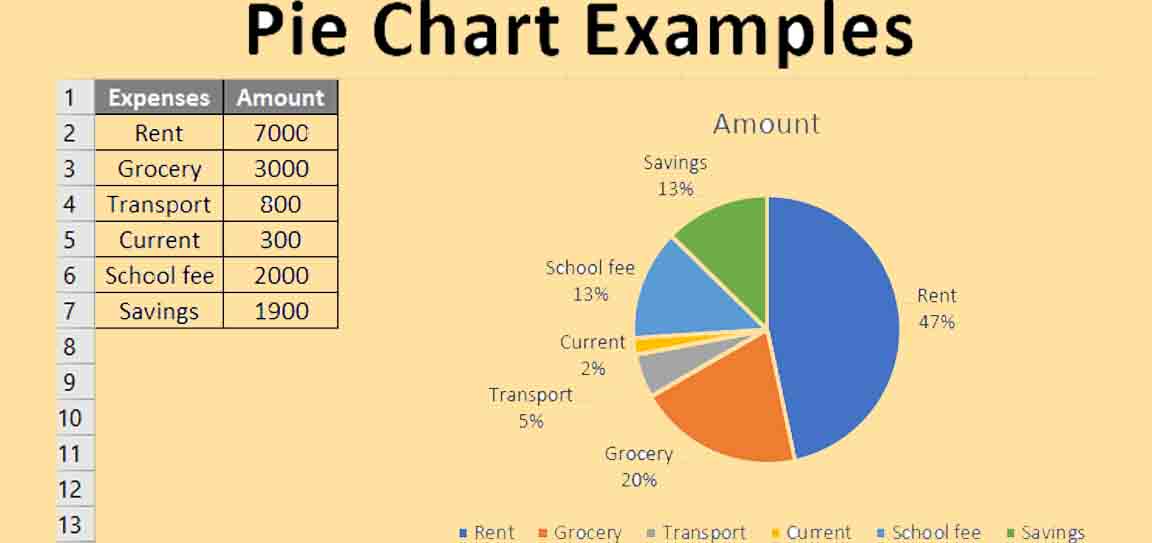
Table of content
A. Tổng quan về dạng bài IELTS Writing Task 1 Pie Chart
B. Bài mẫu IELTS Writing Task 1 Pie chart (without trend)
1. Đề bài IELTS Writing task 1 Pie Chart (without trend)
2. Bài mẫu IELTS Writing task 1 Pie Chart (without trend)
3. Phân tích cấu trúc bài mẫu IELTS Writing task 1 Pie Chart (without trend)
4. Phân tích nội dung bài mẫu IELTS Writing task 1 Pie Chart (without trend)
5. Cấu trúc câu và từ vựng trong bài mẫu IELTS Writing task 1 Pie Chart (without trend)
6. Nhận xét & Đánh giá bài mẫu IELTS Writing task 1 Pie Chart (without trend)
C. Bài mẫu IELTS Writing task 1 Pie Chart (with trend)
1. Đề bài IELTS Writing task 1 Pie Chart (with trend)
2. Bài mẫu IELTS Writing task 1 Pie Chart (with trend)
3. Phân tích cấu trúc bài mẫu IELTS Writing task 1 Pie Chart (with trend)
4. Phân tích nội dung bài mẫu IELTS Writing task 1 Pie Chart (with trend)
5. Các từ vựng sử dụng trong IELTS Writing task 1 Pie Chart (with trend)
6. Nhận xét và đánh giá bài mẫu IELTS Writing task 1 Pie Chart (with trend)
A. Tổng quan về dạng bài IELTS Writing Task 1 Pie Chart
Thông thường, có 2 dạng bài biểu đồ hình tròn:
1. Dạng 1 biểu đồ tròn:
Đây là dạng tương đối đơi giản, biểu đồ thuần túy so sánh số liệu, không hề cho thấy sự thay đổi về số liệu của các hạng mục theo thời gian;
2. Dạng 2 biều đồ tròn:
Đây là dạng mà bạn sẽ được cung cấp 2 biểu đồ tròn, mỗi biểu đồ chứa các hạng mục giống nhau như số liệu tương ứng sẽ khác nhau do có sự thay đổi về thời gian;
Thông qua bài viết này, chúng ta sẽ cùng tìm hiểu các bước cơ bản để viết bài IELTS Writing Task 1 dạng biểu đồ tròn thông qua phân tích chi tiết một bài mẫu.
Xem thêm: Bài mẫu chủ đề Writing task 1 – Bar Chart
B. Bài mẫu IELTS Writing Task 1 Pie chart (without trend)
1. Đề bài IELTS Writing task 1 Pie Chart (without trend)
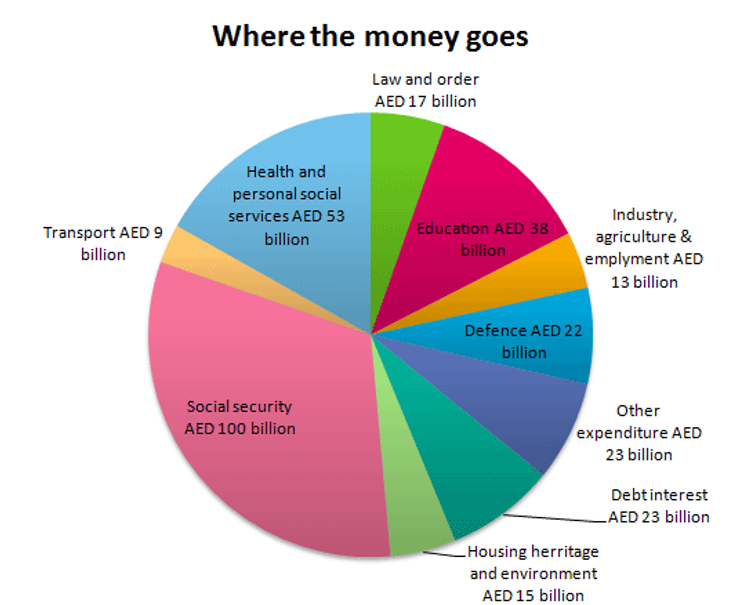
“The pie chart gives information on UAE government spending in 2000. The total budget was AED 315 billion.”
=> Summarise the information by selecting and reporting the main features, and make comparisons where relevant. (Write at least 150 words. )
2. Bài mẫu IELTS Writing task 1 Pie Chart (without trend)
The pie chart shows the UAE government’s budget spending of 315 billion AED in different sectors in 2000.
Overally, UAE government’s maximum spending went in social security and healthcare sectors while the least amounts were spent on transport, law and order, housing and industry/agriculture and employment sectors.
According to the pie chart, the UAE administration allocated AED 100 billion in social security from their national budget of AED 315 billion. This single sector cost the UAE government almost one-third of the total budget. This year the government’s expense was 53 million on health and personal social services, which was the second largest sector in terms of expenditure made by the UAE government. 38 million AED was spent on education while 23 billion both in debt and other expenditures.
The government used 22 billion in Defence sector while 15 billion of the budget was spent on housing and environment. Next, the government spent 13 billion for the industry, employment and agriculture sectors. Finally, The lowest amount of money, only 9 billion, went to the transport sector.
3. Phân tích cấu trúc bài mẫu IELTS Writing task 1 Pie Chart (without trend)
Những đề có dạng một biểu đồ tròn tương đối đơn giản do không thể hiện sự thay đổi của các hạng mục theo thời gian hoặc do các yếu tố khác. Vì thế, nội dung chính của câu trả lời thường nằm ở việc so sánh và xếp hạng các hạng mục theo một đơn vị có sẵn trong bài
Intro
Mục đích của phần mở bài là để giới thiệu khái quát các thông tin và dữ liệu được thể hiện ra trên biểu đồ tròn. Thông thường, cách hiệu quả nhất để viết câu mở bài là dựa vào phần tóm tắt về biểu đồ mà đề bài đưa ra. Tuy nhiên, các bạn cần lưu ý phải viết lại bằng chính ngôn từ của mình chứ không được viết lại y chang phần tóm tắt. 1-2 câu cho phần introduction là đủ. Trong ví dụ, phần tóm tắt đề bài như sau:
The pie chart gives information on UAE government spending in 2000. The total budget was AED 315 billion.
=> Vì thế, chúng ta có thể paraphrase để viết được câu mở bài như sau: The pie chart shows the UAE government’s budget spending of 315 billion AED in different sectors in 2000.
Overview
Phần overview được viết với mục đích giới thiệu các thông tin trong biểu đồ được dùng tới cho bài viết. Khi viết phần này, bạn sẽ phải nêu ra các xu hướng chính hoặc những điểm nổi bật của biểu đồ. Thông thường, ở biểu đồ tròn, điểm nổi bật thường sẽ là sự so sánh về độ lớn của các hạng mục dựa vào kích cỡ tương ứng.
Ý chính trong bài:
Highest spendings: social security and healthcare;
Lowest spendings: transport, law and order, housing and industry/agriculture and employment sectors.
Ví dụ: Overally, UAE government’s maximum spending went in social security and healthcare sectors while the least amounts were spent on transport, law and order, housing and industry/agriculture and employment sectors.
Body 1
Sau phần overview, chúng ta sẽ bắt viết chi tiết các thông tin được đề cập trong phần Overview. Trong ví dụ chúng ta có thân bài đoạn 1 như sau:
Ý chính trong bài
100 billion in social security ⇒ highest;
53 million on health and personal social services ⇒ second;
38 million AED was spent on education;
23 billion both in debt and other expenditures.
Ví dụ: According to the pie chart, the UAE administration allocated AED 100 billion in social security from their national budget of AED 315 billion. This single sector cost the UAE government almost one-third of the total budget. This year the government’s expense was 53 million on health and personal social services, which was the second largest sector in terms of expenditure made by the UAE government. 38 million AED was spent on education while 23 billion both in debt and other expenditures.
Body 2
Tiếp tục, đoạn 2 chúng ta vẫn tiếp tục so sánh các hạng mục tiếp theo:
Ý chính trong bài:
22 billion in Defence sector;
15 billion of the budget was spent on housing and environment;
3 billion for the industry, employment and agriculture sectors;
9 billion, went to the transport sector.
Ví dụ: The government used 22 billion in Defence sector while 15 billion of the budget was spent on housing and environment. Next, the government spent 13 billion for the industry, employment and agriculture sectors. Finally, The lowest amount of money, only 9 billion, went to the transport sector.
4. Phân tích nội dung bài mẫu IELTS Writing task 1 Pie Chart (without trend)
Phân tích cách triển khai ý:
Overview
Các ý trong phần Overview là được triển khai thông qua việc quan sát tổng quan biểu đồ. Bản chất của biểu đồ hình tròn thường chỉ giới hạn trong việc liệt kê và so sánh các hạng mục với nhau. Vì thế trong cách triển khai ý tổng quát, chúng ta có thể miêu tả hạng mục có số liệu cao nhất và các hạng mục có số liệu thấp nhất.
Khi nhìn vào biểu đồ trong ví dụ, chúng ta có thể nhận ra được ngay hạng mục chiếm phần lớn nhất tương ứng với phần dữ liệu cao nhất so với các hạng mục khác.
Ví dụ:
Overally, UAE government’s maximum spending went in social security and healthcare sectors while the least amounts were spent on transport, law and order, housing and industry/agriculture and employment sectors.
Body 1
Trong đoạn này, chúng ta đề cập tới hạng mục có phần biểu hiện to nhất, tương ứng với số liệu lớn nhất là social security – one-third of the total budget. Sau đó, chúng ta tiếp tục so sánh và đưa ra các hạng mục có giá trị theo thứ tự từ lớn đến thấp
=> 53 million on health and personal social services, which was the second largest ⇒ 38 million AED was spent on education ⇒ 23 billion both in debt and other expenditures.*
Ví dụ:
According to the pie chart, the UAE administration allocated AED 100 billion in social security from their national budget of AED 315 billion. This single sector cost the UAE government almost one-third of the total budget. This year the government’s expense was 53 million on health and personal social services, which was the second largest sector in terms of expenditure made by the UAE government. 38 million AED was spent on education while 23 billion both in debt and other expenditures.
Body 2
The government used 22 billion in Defence sector while 15 billion of the budget was spent on housing and environment. Next, the government spent 13 billion for the industry, employment and agriculture sectors. Finally, the lowest amount of money, only 9 billion, went to the transport sector.
5. Cấu trúc câu và từ vựng trong bài mẫu IELTS Writing task 1 Pie Chart (without trend)
Cấu trúc câu được sử dụng trong bài để miêu tả số liệu
Intro:
The pie chart shows the UAE government’s budget spending of 315 billion AED in different sectors in 2000. => Cấu trúc câu: S + show (present tense) something.
Overview:
Overally, UAE government’s maximum spending went in social security and healthcare sectors while the least amounts were spent on transport, law and order, housing and industry/agriculture and employment sectors.
=> Cấu trúc câu ghép: S1 + go (past tense), while, S2 + be spent on something.
Body:
-According to the pie chart, the UAE administration allocated AED 100 billion in social security from their national budget of AED 315 billion.
=> Cấu trúc câu: According to something, S + allocate (past tense) something in something.
-This single sector cost the UAE government almost one-third of the total budget.
=> Cấu trúc câu: S + cost (past tense) something.
-This year the government’s expense was 53 million on health and personal social services, which was the second largest sector in terms of expenditure made by the UAE government.
=> Cấu trúc câu: S + be (past tense) something , which be (past tense) something.
-38 million AED was spent on education while 23 billion both in debt and other expenditures.
=> Cấu trúc câu: S + be (past tense) on something.
-The government used 22 billion in Defence sector while 15 billion of the budget was spent on housing and environment. => Cấu trúc câu: S1 + use (past tense), while, S2 + be spent on.
-Next, the government spent 13 billion for the industry, employment and agriculture sectors. => Cấu trúc câu: S + spend (past tense).
-Finally, The lowest amount of money, only 9 billion, went to the transport sector. => Cấu trúc câu: S + go to (past tense)
Lưu ý: Chủ đề mà chúng ta vừa phân tích là về chi phí, tiền bạc nên các cấu trúc câu dùng để miêu tả giá trị như S + cost something được sử dụng. Tuy nhiên với những chủ đề khác thì có thể cấu trúc trên không áp dụng được. Sau đây là một số cấu trúc câu mà bạn có thể dùng để miêu tả các thông tin của biểu đồ tròn:
There + be + number => Ví dụ: There were 4 million Dutch citizens, accounted for 40% of the population, voted for him.
To account for/constitute/amount to/occupy => Ví dụ: Toyota’s expenditure on TV advertising last year accounted for 30%.
The amount/ number/percentage + be + number => Ví dụ: The percentage was 45%.
Number + be +The amount/ number/percentage of something. => Ví dụ: 45% is the percentage of women who have more than 2 children in Vietnam.
Các từ vựng được sử dụng trong bài
Từ vựng mang tính chất so sánh
The least amounts;
The second largest;
The lowest amount.
Từ vựng miêu tả việc đầu tư, chi xài
Be spent on;
To cost something;
To spend amount of money on;
To use amount of money on.
6. Nhận xét & Đánh giá bài mẫu IELTS Writing task 1 Pie Chart (without trend)
Ở phần overview, bài mẫu gặp phải vấn đề lặp từ “sectors”;
Cách triển khai ý cho phần thân bài chủ yếu là liệt kê từ cao nhất đến thấp nhất các số liệu. Vì thế, các cấu trúc câu sử dụng trong bài không đa dạng, chủ yếu là để chỉ liệt kê giá (cost, expense, spend, v.v);
Cách liệt kê từng giá trị từ lớn xuống nhỏ tuy đúng nhưng sẽ không giúp bạn được điểm cao. Gợi ý: chia làm 2 nhóm: nhóm thấp nhất miêu tả từ giá trị thấp nhất, nhóm cao nhất miêu tả từ hạng mục cao nhất.
C. Bài mẫu IELTS Writing task 1 Pie Chart (with trend)
1. Đề bài IELTS Writing task 1 Pie Chart (with trend)
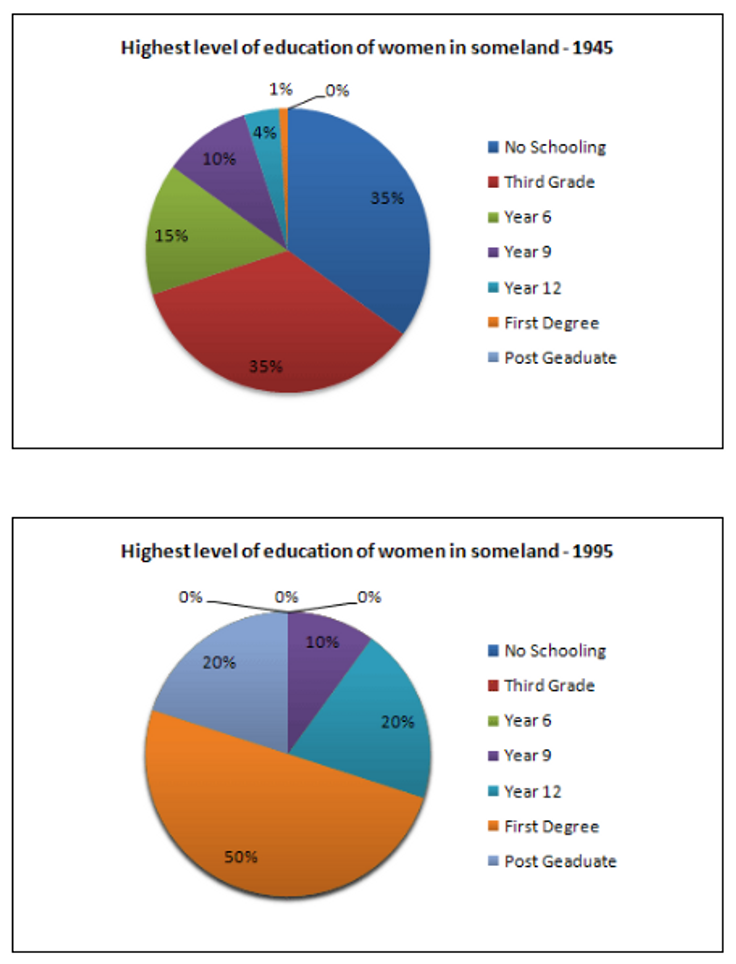
“The pie charts below show information on the highest level of education of women in Someland in 1945 and 1995.”
=> Write a report for a university lecturer describing the information in the two graphs below.
2. Bài mẫu IELTS Writing task 1 Pie Chart (with trend)
The pie charts show how the women education scenario in Someland changed by comparing the highest level of female education in 1995 with that of five decades earlier
Overall, a notable progress in education was achieved by women in Someland.
According to the diagrams, more than one-third women in Someland did not receive any formal education in 1945 while another one-third dropped out before they even completed their primary education. This is a dismaying figure for women in terms of their schooling in Someland in 1945. Moreover, almost a quarter female merely finished their sixth and ninth grades whereas only 4% made it to their 12th grades. Merely 1% of these women were awarded their first-degree certificates while none of them earned the post-graduation qualification.
However, after fifty years, the progress was remarkable when one in every five women in Someland finished their post-graduation, half of them earned their first-degree and all women finished at least grade 9. No women in Someland in 1995 was deprived of their education and 20% of them finished school years to finish their 12 grades.
3. Phân tích cấu trúc bài mẫu IELTS Writing task 1 Pie Chart (with trend)
Intro
Như đã hướng dẫn từ trước, để có thể viết đúng và nhanh chóng phần mở bài, chúng ta có thể paraphrase lại phần tóm tắt mà đề bài đưa ra
Ý chính trong phần intro: Women education in Someland from 1995 and 1945.
⇒ Ví dụ: The pie charts show how the women education scenario in Someland changed by comparing the highest level of female education in 1995 with that of five decades earlier.
Overview
Phần overview sẽ được viết đề thể hiện mang tính chất tổng quát giới thiệu thể hiện những thông tin mà bạn sẽ miêu tả chi tiết ở phần thân bài
Ý chính trong phần overview: Women in Someland achieve higher education in 1995 compare to 1945.
⇒ Ví dụ: Overall, a notable progress in education was achieved by women in Someland.
Body 1
Phần body sẽ tập trung vào việc miêu tả, so sánh các ý chi tiết mà phần overview đã giới thiệu
Ý chính trong phần body 1
In 1945
35% received no education;
35% quitted before finishing Primary School;
15%: Grade 6;
10%: Grade 9;
4%: Grade 12;
1%: Certificate;
0%: Post graduation.
Ví dụ cho Body 1:
According to the diagrams, more than one-third women in Someland did not receive any formal education in 1945 while another one-third dropped out before they even completed their primary education. This is a dismaying figure for women in terms of their schooling in Someland in 1945. Moreover, almost a quarter female merely finished their sixth and ninth grades whereas only 4% made it to their 12th grades. Merely 1% of these women were awarded their first-degree certificates while none of them earned the post-graduation qualification.
Body 2
Ý chính trong phần body 2
In 1995:
Made progress;
20% post graduate;
50% received certificate;
Other: grade 9 at least.
Ví dụ cho Body 2:
However, after fifty years, the progress was remarkable when one in every five women in Someland finished their post-graduation, half of them earned their first-degree and all other women finished at least grade 9. No women in Someland in 1995 was deprived of their education and 20% of them finished school years to finish their 12 grades.
4. Phân tích nội dung bài mẫu IELTS Writing task 1 Pie Chart (with trend)
Phân tích cách triển khai ý
Overview: nói về cái gì, từ cái đó chia số liệu thành các nhóm nào
Nhìn vào 2 biểu đồ, chúng ta có thể thấy sự thay đổi ngay lập tức ở việc tỷ lệ phụ nữ bỏ học ở năm lớp 6 đã hoàn toàn biết mất vào năm 1995 so với năm 1945. Ngoài ra tỷ lệ phụ nữ ở những mức độ giáo dục còn lại cũng tăng lên một cách đáng kể.
⇒ Ví dụ: Overall, a notable progress in education was achieved by women in Someland.
Body 1: nói về nhóm nào, trích số liệu gì
Ở phần body 1, chúng ta sẽ miêu tả cả số liệu thống kê về trình độ học vấn của phụ nữ Someland ở những năm 1945:
Ví dụ: According to the diagrams, more than one-third women in Someland did not receive any formal education in 1945 while another one-third dropped out before they even completed their primary education. This is a dismaying figure for women in terms of their schooling in Someland in 1945. Moreover, almost a quarter female merely finished their sixth and ninth grades whereas only 4% made it to their 12th grades. Merely 1% of these women were awarded their first-degree certificates while none of them earned the post-graduation qualification.
Body 2: Nói về nhóm nào
Ở phần body 2, chúng ta sẽ cho thấy sự cải thiện về trình độ học vấn của phụ nữ Someland ở năm 1995.
Ví dụ: However, after fifty years, the progress was remarkable when one in every five women in Someland finished their post-graduation, half of them earned their first-degree and all women finished at least grade 9. No women in Someland in 1995 was deprived of their education and 20% of them finished school years to finish their 12 grades.
Phân tích ngôn ngữ sử dụng
Cấu trúc câu được sử dụng trong bài:
Intro
The pie charts show how the women education scenario in Someland changed by comparing the highest level of female education in 1995 with that of five decades earlier.
=> Cấu trúc câu: S + show (present) something, by comparing something with something.
Overview
Overall, a notable progress in education was achieved by women in Someland.
=> Cấu trúc câu: S + be achieved
Body
This is a dismaying figure for women in terms of their schooling in Someland in 1945.
=> Cấu trúc câu: S + be + something
5. Các từ vựng sử dụng trong IELTS Writing task 1 Pie Chart (with trend)
Các từ chỉ tỷ lệ
One third;
A quarter;
4%, 1%, 20%;
Half;
All;
One in every five.
Các từ chỉ mức độ thay đổi
6. Nhận xét và đánh giá bài mẫu IELTS Writing task 1 Pie Chart (with trend)
Bài mẫu thể hiện và đánh giá được xu hướng thay đổi của số liệu và sự liên quan giữa 2 bảng số liệu. Số liệu được miêu tả chính xác;
Vốn từ vựng miêu tả số lượng khá (1%, one third, a quarter), cách sử dụng từ đúng ngữ cảnh, không bị sai cách dùng từ;
Các đoạn được phân chia hợp lý, có sử dụng các cohesive devices (according to the diagrams, however, moreover,…).
Để biết rõ hơn về phương pháp cũng như lộ trình luyện thi IELTS phù hợp cho bản thân các bạn có thể nhắn tin cho DOL qua fanpage theo đường dẫn: https://m.me/dolenglish/ để được tư vấn hoặc để lại thông tin theo đường dẫn sau DOL sẽ gọi điện tư vấn cho các bạn: Mẫu đăng ký nhận tư vấn
Bài viết khác
Bài thi IELTS Writing Task 1 yêu cầu chúng ta viết bài văn học thuật dài ít nhất 150 chữ trong thời gian 20 phút mô tả dữ liệu được trình bày dưới dạng đồ thị, bảng, hay quy trình. Để viết bài IELTS Writing Task 1 thành công, chúng ta phải trình bày được ngôn ngữ tả số liệu, xu hướng và so sánh, và phải có kỹ năng chọn ra thông tin nổi bật nhất, cũng như chứng minh được thông tin nổi bật đó bằng những thông tin chi tiết hơn.

Task 1 IELTS Table – Dạng bảng biểu là một trong những dạng bài khó trong phần thi IELTS Writing task 1 vì có rất nhiều số liệu. Trong khi đa phần các dạng writing task 1 ielts có biểu đồ thường có số liệu trình bày dưới dạng hình vẽ, rất dễ để ta quan sát hay so sánh xu hướng thay đổi thì ở Table Chart IELTS, các dữ liệu đưa ra dưới dạng bảng và có rất nhiều con số được đưa ra để bạn phân tích, điều này rất dễ nhiễu cho người viết. Để hỗ trợ các bạn làm tốt dạng bài này, chúng ta sẽ cùng phân tích một bài mẫu bằng phương pháp hiệu quả. Dạng bảng (Table) trong IELTS Writing Task 1 có 2 dạng là: Dạng table không có xu hướng (Table without time/trend); Dạng table có thể hiện xu hướng, sự thay đổi của số liệu từng hạng mục theo thời gian.

Việc tìm hiểu trước các chủ đềwriting ielts thường gặp sẽ giúp bạn vừa có thời gian tiếp xúc và quen với cách làm, vừa hình thành sẵn những kiến thức căn bản để bạn áp dụng và phát triển thêm trong phòng thi. Vậy nên, trong bài viết dưới đây, DOL sẽ tổng hợp tất cả 24 chủ đề IELTS Writing Task 2, hãy cùng “take note” lại ngay nhé! Không phải là nói quá khi nói rằng IELTS Writing Task 2 là phần thi khó nhằn nhất trong bài kiểm tra tiếng Anh chuẩn hoá IELTS (International English Language Testing System). Những năm gần đây, các chủ đề được nhắc đến trong Writing IELTS Task 2 càng ngày càng mang tính thời sự.

Bài thi IELTS Writing Task 2 về cơ bản có tổng cộng 4 dạng đề và dạng essay Advantages and Disadvantages là một trong số đó. Đây là dạng tương đối khó và tần suất xuất hiện tương đối cao. Vì thế, thông qua bài viết này, chúng ta sẽ cùng tìm hiểu cách viết dạng bài advantage and disadvantage hiệu quả để có thể đạt được điểm như mong muốn trong kỳ thi IELTS sắp tới. Chủ đề liên quan: Hướng dẫn viết dạng Cause-Problem-Solution trong IELTS Writing Task 2

IELTS Writing Task 1 Process là dạng đề tương đối ít gặp trong phần thi IELTS Writing nhưng không có nghĩa là bạn có thể xem thường dạng này. Chúng ta cần phải chuẩn bị kỹ càng cho mọi tình huống có thể xảy ra. Thông thường, dạng bài này yêu cầu người viết miêu tả một quá trình tự nhiên hay nhân tạo nào đó, bao gồm nhiều bước liên tiếp nhau để tạo thành một sản phẩm hoàn chỉnh. Với dạng Process ta phải đưa hết tất cả các bước(không chừa bước nào) nên không phải chọn những đặc điểm chung, mà chỉ đơn giản là thấy gì viết nấy. Vì thế, chúng ta nên để ý kỹ xem có bao nhiêu bước trong quy trình để không bỏ lỡ.

Table of content
A. Tổng quan về dạng bài IELTS Writing Task 1 Pie Chart
B. Bài mẫu IELTS Writing Task 1 Pie chart (without trend)
1. Đề bài IELTS Writing task 1 Pie Chart (without trend)
2. Bài mẫu IELTS Writing task 1 Pie Chart (without trend)
3. Phân tích cấu trúc bài mẫu IELTS Writing task 1 Pie Chart (without trend)
4. Phân tích nội dung bài mẫu IELTS Writing task 1 Pie Chart (without trend)
5. Cấu trúc câu và từ vựng trong bài mẫu IELTS Writing task 1 Pie Chart (without trend)
6. Nhận xét & Đánh giá bài mẫu IELTS Writing task 1 Pie Chart (without trend)
C. Bài mẫu IELTS Writing task 1 Pie Chart (with trend)
1. Đề bài IELTS Writing task 1 Pie Chart (with trend)
2. Bài mẫu IELTS Writing task 1 Pie Chart (with trend)
3. Phân tích cấu trúc bài mẫu IELTS Writing task 1 Pie Chart (with trend)
4. Phân tích nội dung bài mẫu IELTS Writing task 1 Pie Chart (with trend)
5. Các từ vựng sử dụng trong IELTS Writing task 1 Pie Chart (with trend)
6. Nhận xét và đánh giá bài mẫu IELTS Writing task 1 Pie Chart (with trend)